Description
Usage
Value
Arguments
Methods (by generic)
See Also
Examples
Run this codeif (FALSE) {
set_flextable_defaults(digits = 2, border.color = "gray")
library(data.table)
# example 1 ----
if (require("stats")) {
dat <- aggregate(breaks ~ wool + tension,
data = warpbreaks, mean
)
cft_1 <- tabulator(
x = dat, rows = "wool",
columns = "tension",
`mean` = as_paragraph(as_chunk(breaks)),
`(N)` = as_paragraph(as_chunk(length(breaks), formatter = fmt_int))
)
ft_1 <- as_flextable(cft_1)
ft_1
}
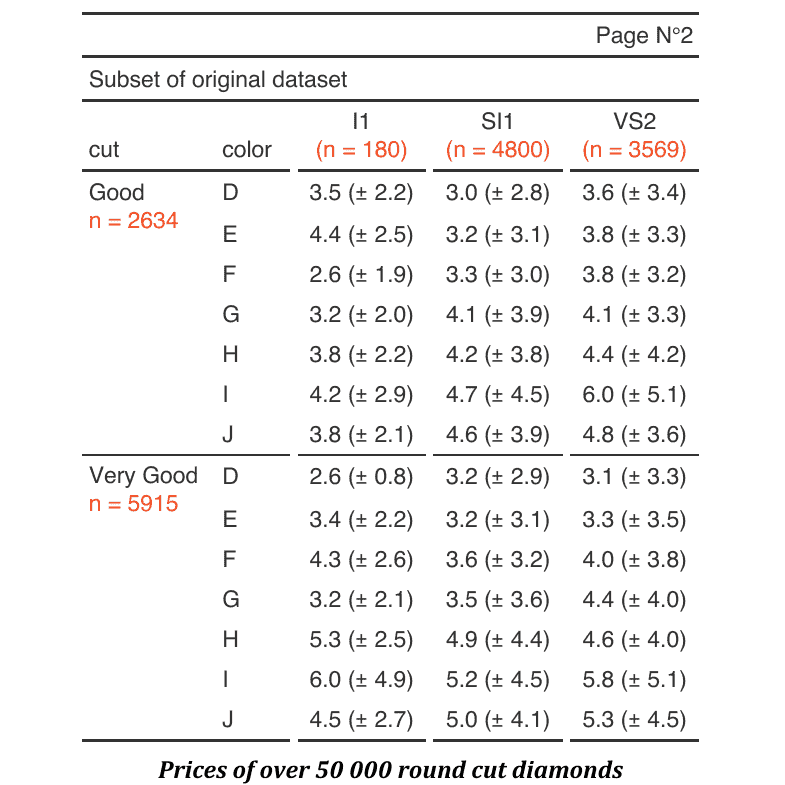
# example 2 ----
if (require("ggplot2")) {
multi_fun <- function(x) {
list(mean = mean(x), sd = sd(x))
}
dat <- as.data.table(ggplot2::diamonds)
dat <- dat[cut %in% c("Fair", "Good", "Very Good")]
dat <- dat[, unlist(lapply(.SD, multi_fun),
recursive = FALSE
),
.SDcols = c("z", "y"),
by = c("cut", "color")
]
tab_2 <- tabulator(
x = dat, rows = "color",
columns = "cut",
`z stats` = as_paragraph(as_chunk(fmt_avg_dev(z.mean, z.sd, digit2 = 2))),
`y stats` = as_paragraph(as_chunk(fmt_avg_dev(y.mean, y.sd, digit2 = 2)))
)
ft_2 <- as_flextable(tab_2)
ft_2 <- autofit(x = ft_2, add_w = .05)
ft_2
}
# example 3 ----
# data.table version
dat <- melt(as.data.table(iris),
id.vars = "Species",
variable.name = "name", value.name = "value"
)
dat <- dat[,
list(
avg = mean(value, na.rm = TRUE),
sd = sd(value, na.rm = TRUE)
),
by = c("Species", "name")
]
# dplyr version
# library(dplyr)
# dat <- iris %>%
# pivot_longer(cols = -c(Species)) %>%
# group_by(Species, name) %>%
# summarise(avg = mean(value, na.rm = TRUE),
# sd = sd(value, na.rm = TRUE),
# .groups = "drop")
tab_3 <- tabulator(
x = dat, rows = c("Species"),
columns = "name",
`mean (sd)` = as_paragraph(
as_chunk(avg),
" (", as_chunk(sd), ")"
)
)
ft_3 <- as_flextable(tab_3)
ft_3
init_flextable_defaults()
}
Run the code above in your browser using DataLab