Description
Usage
Value
Arguments
method argument
Example Output
See Also
Examples
Run this code# \donttest{
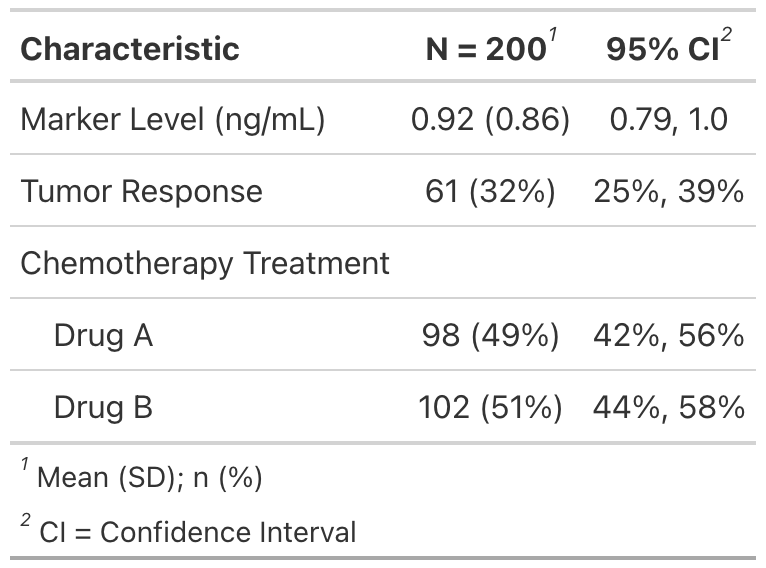
# Example 1 ----------------------------------
add_ci_ex1 <-
trial %>%
select(marker, response, trt) %>%
tbl_summary(missing = "no",
statistic = all_continuous() ~ "{mean} ({sd})") %>%
add_ci()
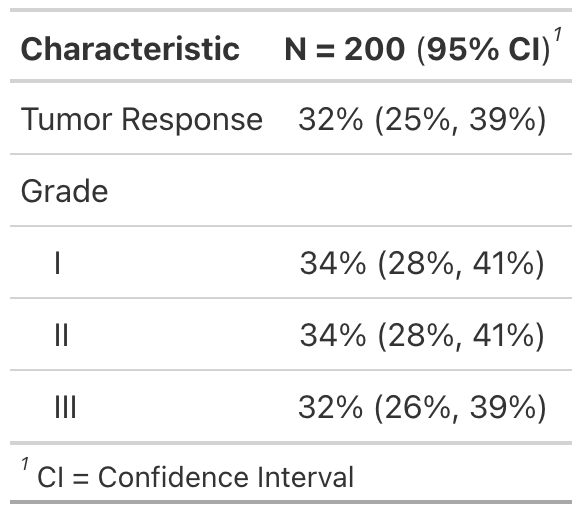
# Example 2 ----------------------------------
add_ci_ex2 <-
trial %>%
select(response, grade) %>%
tbl_summary(statistic = all_categorical() ~ "{p}%",
missing = "no") %>%
add_ci(pattern = "{stat} ({ci})") %>%
modify_footnote(everything() ~ NA)
# }
Run the code above in your browser using DataLab