Description
Usage
Arguments
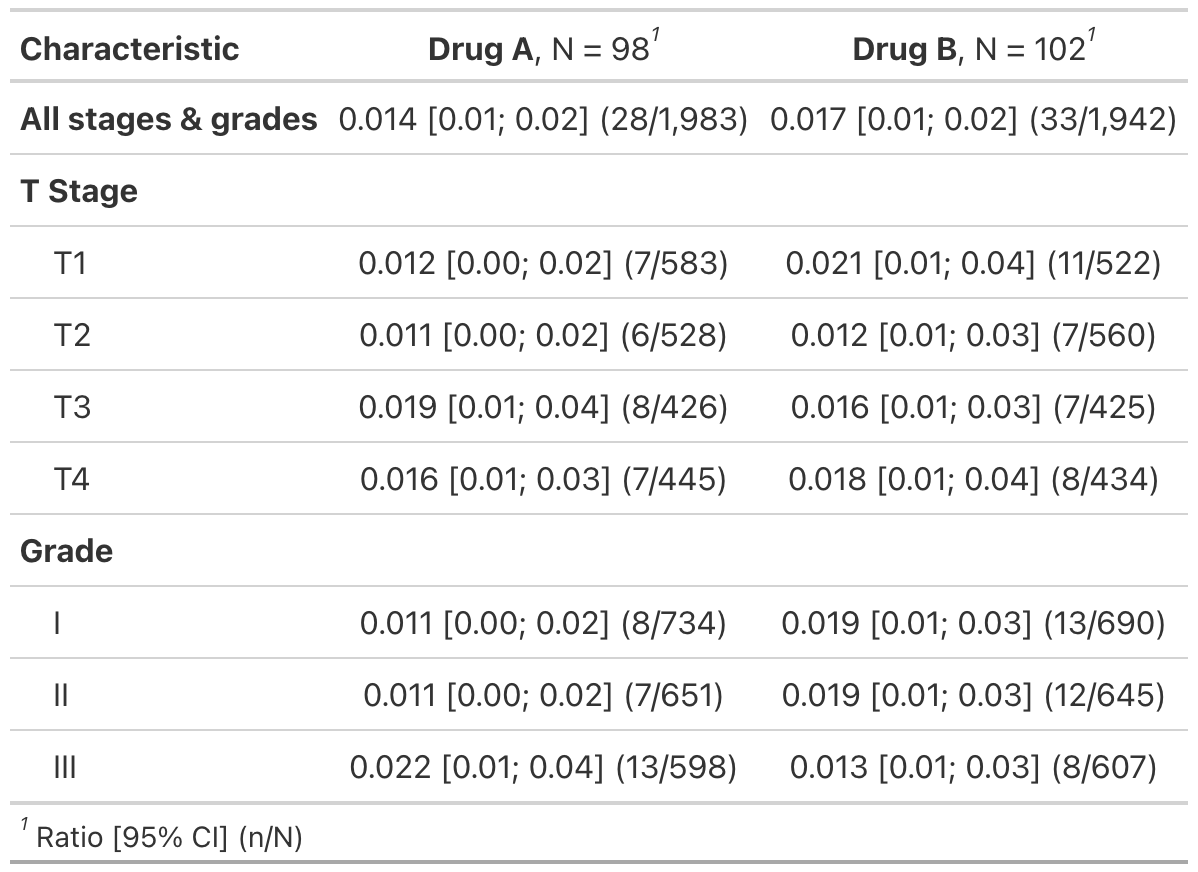
Example Output
Author
Details
See Also
Examples
Run this code# Example 1 ----------------------------------
ratio_summary_ex1 <-
trial %>%
tbl_custom_summary(
include = c("stage", "grade"),
by = "trt",
stat_fns = ~ ratio_summary("response", "ttdeath"),
statistic = ~ "{ratio} [{conf.low}; {conf.high}] ({num}/{denom})",
digits = ~ c(3, 2, 2, 0, 0),
overall_row = TRUE,
overall_row_label = "All stages & grades"
) %>%
bold_labels() %>%
modify_footnote(
update = all_stat_cols() ~ "Ratio [95% CI] (n/N)"
)
Run the code above in your browser using DataLab