add_n.tbl_summary: Add column with N
Description
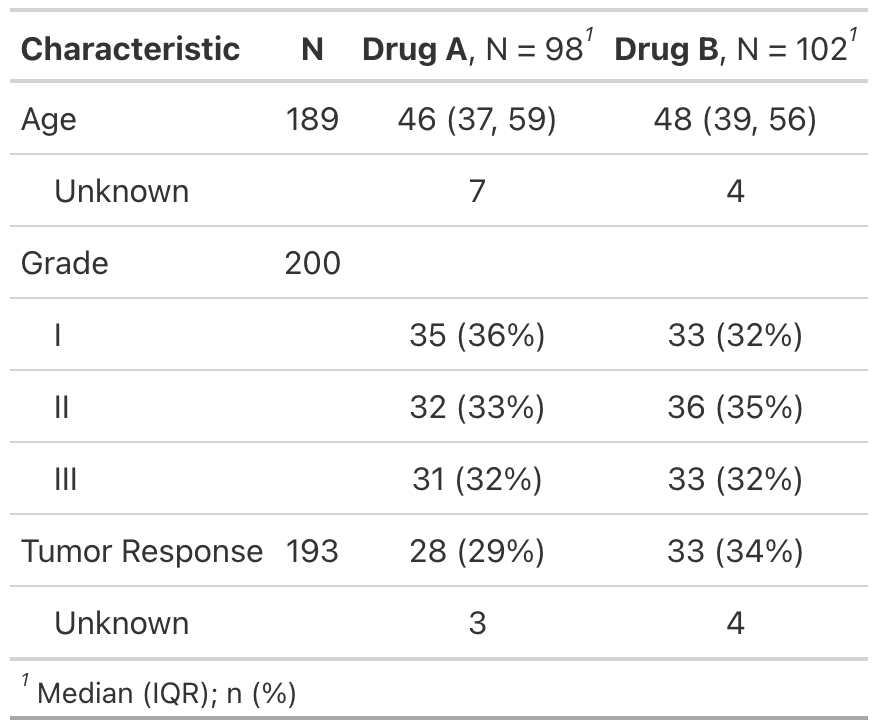
For each variable in a tbl_summary table, the add_n function adds a column with the
total number of non-missing (or missing) observations
Usage
# S3 method for tbl_summary
add_n(
  x,
  statistic = "{n}",
  col_label = "**N**",
  footnote = FALSE,
  last = FALSE,
  ...
)# S3 method for tbl_svysummary
add_n(
  x,
  statistic = "{n}",
  col_label = "**N**",
  footnote = FALSE,
  last = FALSE,
  ...
)
Value
A tbl_summary or tbl_svysummary object
Arguments
- x
Object with class
tbl_summaryfrom the tbl_summary function or with classtbl_svysummaryfrom the tbl_svysummary function- statistic
String indicating the statistic to report. Default is the number of non-missing observation for each variable,
statistic = "{n}". Other statistics available to report include:"{N_obs}"total number of observations,"{N_nonmiss}"number of non-missing observations,"{N_miss}"number of missing observations,"{p_nonmiss}"percent non-missing data,"{p_miss}"percent missing datasurvey summaries also have the following unweighted statistics available:
"N_obs_unweighted","N_miss_unweighted","N_nonmiss_unweighted","p_miss_unweighted","p_nonmiss_unweighted"
- col_label
String indicating the column label. Default is
"**N**"- footnote
Logical argument indicating whether to print a footnote clarifying the statistics presented. Default is
FALSE- last
Logical indicator to include N column last in table. Default is
FALSE, which will display N column first.- ...
Not used
The argument uses glue::glue syntax and multiple statistics may be reported,
e.g. statistic = "{N_nonmiss} / {N_obs} ({p_nonmiss}%)"
Example Output
Example 1
Author
Daniel D. Sjoberg
See Also
Review list, formula, and selector syntax used throughout gtsummary
Other tbl_summary tools:
add_ci(),
add_overall(),
add_p.tbl_summary(),
add_q(),
add_stat_label(),
bold_italicize_labels_levels,
inline_text.tbl_summary(),
inline_text.tbl_survfit(),
modify,
separate_p_footnotes(),
tbl_custom_summary(),
tbl_merge(),
tbl_split(),
tbl_stack(),
tbl_strata(),
tbl_summary()
Other tbl_svysummary tools:
add_overall(),
add_p.tbl_svysummary(),
add_q(),
add_stat_label(),
modify,
separate_p_footnotes(),
tbl_merge(),
tbl_split(),
tbl_stack(),
tbl_strata(),
tbl_svysummary()
Examples
Run this code# Example 1 ----------------------------------
tbl_n_ex <-
trial[c("trt", "age", "grade", "response")] %>%
tbl_summary(by = trt) %>%
add_n()
Run the code above in your browser using DataLab