add_significance_stars: Add significance stars
Description
lifecycle::badge("experimental") Add significance stars to estimates with small p-values
Usage
add_significance_stars(
  x,
  pattern = NULL,
  thresholds = c(0.001, 0.01, 0.05),
  hide_ci = TRUE,
  hide_p = inherits(x, c("tbl_regression", "tbl_uvregression")),
  hide_se = FALSE
)
Arguments
- x
a
'gtsummary'object with a'p.value'column- pattern
glue-syntax string indicating what to display in formatted column. Default is
"{estimate}{stars}"for regression summaries and"{p.value}{stars}"otherwise. A footnote is placed on the first column listed in the pattern. Other common patterns are"{estimate}{stars} ({conf.low}, {conf.high})"and"{estimate} ({conf.low} to {conf.high}){stars}"- thresholds
thresholds for significance stars. Default is
c(0.001, 0.01, 0.05)- hide_ci
logical whether to hide confidence interval. Default is
TRUE- hide_p
logical whether to hide p-value. Default is
TRUEfor regression summaries, andFALSEotherwise.- hide_se
logical whether to hide standard error. Default is
FALSE
Future Updates
There are planned updates to the implementation of this function
with respect to the pattern= argument.
Currently, this function replaces the numeric estimate column, with a
formatted character column following pattern=.
Once gt::cols_merge() gains the rows= argument the
implementation will be updated to use it, which will keep
numeric columns numeric. For the vast majority of users,
the planned change will be go unnoticed.
Example Output
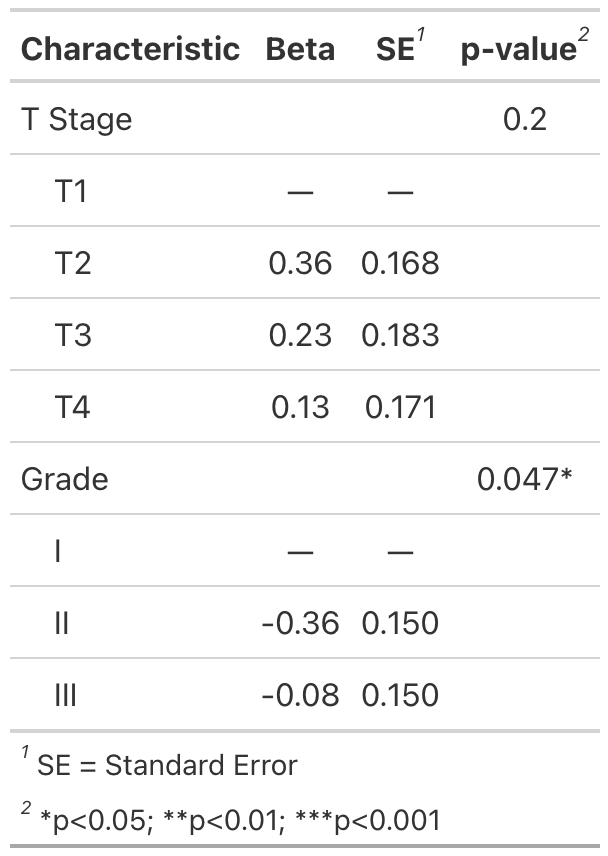
Example 1
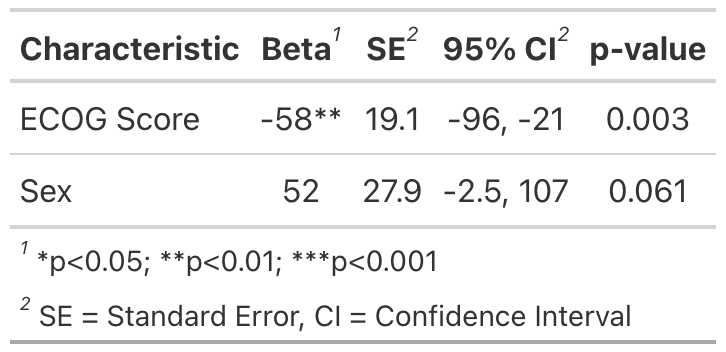
Example 2
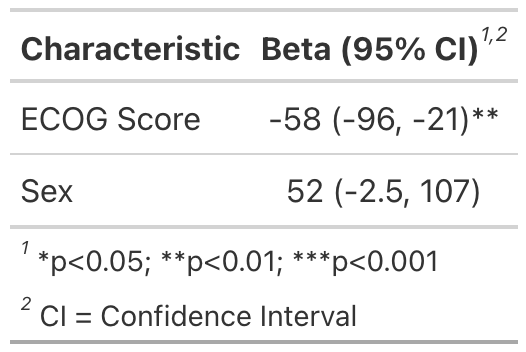
Example 3
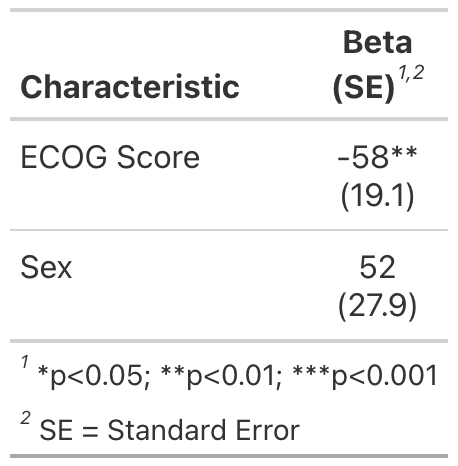
Example 4