Description
Usage
Arguments
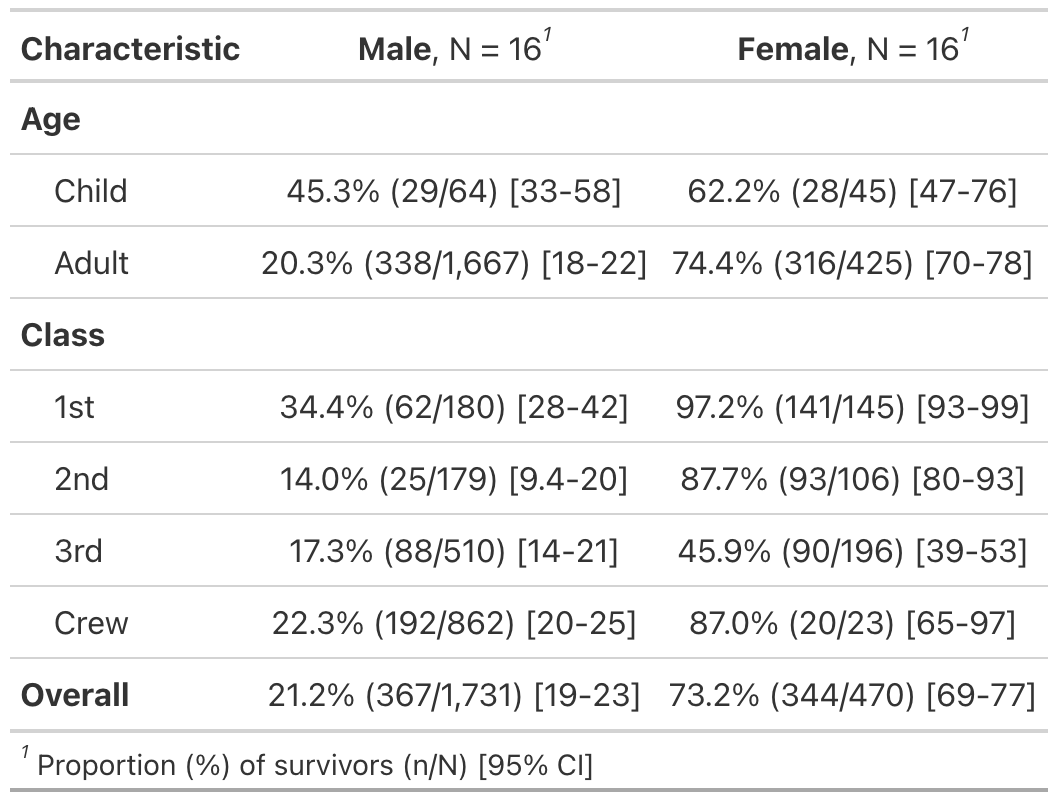
Example Output
Author
Details
See Also
Examples
Run this code# Example 1 ----------------------------------
proportion_summary_ex1 <-
Titanic %>%
as.data.frame() %>%
tbl_custom_summary(
include = c("Age", "Class"),
by = "Sex",
stat_fns = ~ proportion_summary("Survived", "Yes", weights = "Freq"),
statistic = ~ "{prop}% ({n}/{N}) [{conf.low}-{conf.high}]",
digits = ~ list(
function(x) {style_percent(x, digits = 1)},
0, 0, style_percent, style_percent
),
overall_row = TRUE,
overall_row_last = TRUE
) %>%
bold_labels() %>%
modify_footnote(
update = all_stat_cols() ~ "Proportion (%) of survivors (n/N) [95% CI]"
)
Run the code above in your browser using DataLab