Description
Usage
Value
Arguments
Similarities with <code>tbl_summary()</code>
<code>stat_fns</code> argument
statistic argument
Caution
Example Output
Author
See Also
Examples
Run this code# \donttest{
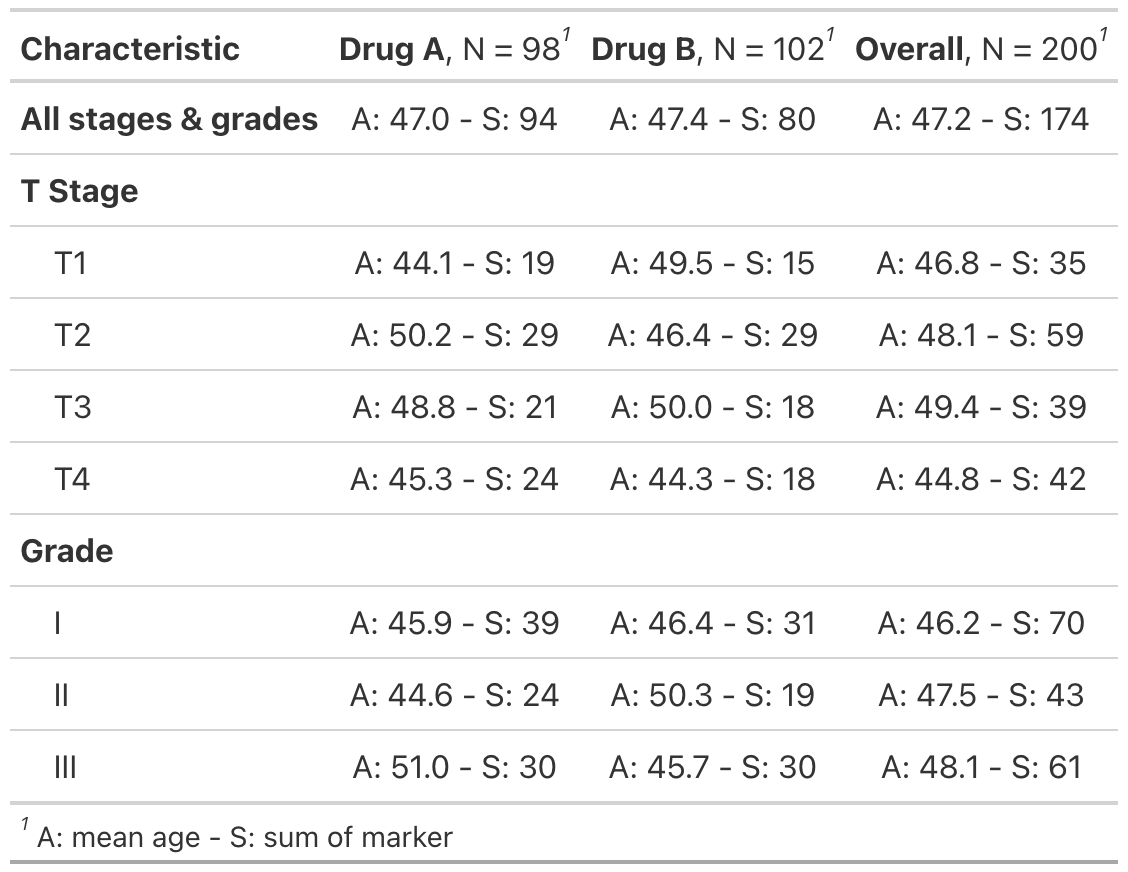
# Example 1 ----------------------------------
my_stats <- function(data, ...) {
marker_sum = sum(data$marker, na.rm = TRUE)
mean_age = mean(data$age, na.rm = TRUE)
dplyr::tibble(
marker_sum = marker_sum,
mean_age = mean_age
)
}
my_stats(trial)
tbl_custom_summary_ex1 <-
trial %>%
tbl_custom_summary(
include = c("stage", "grade"),
by = "trt",
stat_fns = everything() ~ my_stats,
statistic = everything() ~ "A: {mean_age} - S: {marker_sum}",
digits = everything() ~ c(1, 0),
overall_row = TRUE,
overall_row_label = "All stages & grades"
) %>%
add_overall(last = TRUE) %>%
modify_footnote(
update = all_stat_cols() ~ "A: mean age - S: sum of marker"
) %>%
bold_labels()
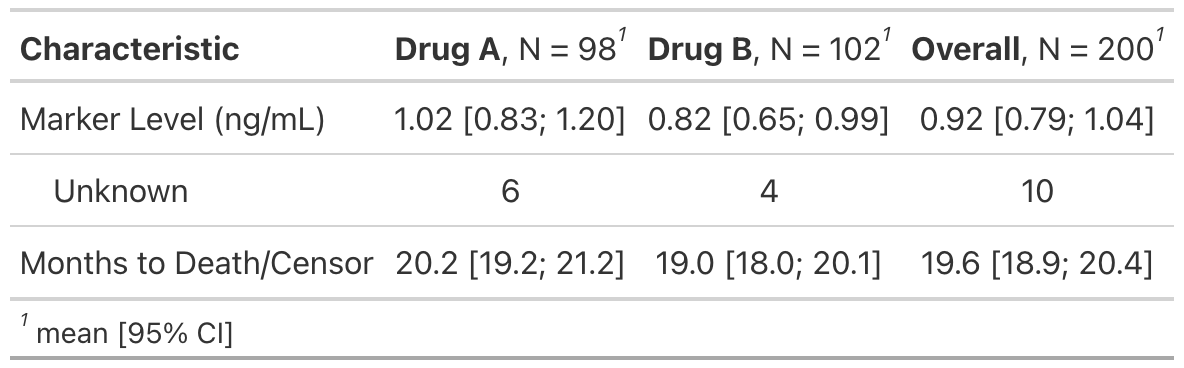
# Example 2 ----------------------------------
# Use `data[[variable]]` to access the current variable
mean_ci <- function(data, variable, ...) {
test <- t.test(data[[variable]])
dplyr::tibble(
mean = test$estimate,
conf.low = test$conf.int[1],
conf.high = test$conf.int[2]
)
}
tbl_custom_summary_ex2 <-
trial %>%
tbl_custom_summary(
include = c("marker", "ttdeath"),
by = "trt",
stat_fns = ~ mean_ci,
statistic = ~ "{mean} [{conf.low}; {conf.high}]"
) %>%
add_overall(last = TRUE) %>%
modify_footnote(
update = all_stat_cols() ~ "mean [95% CI]"
)
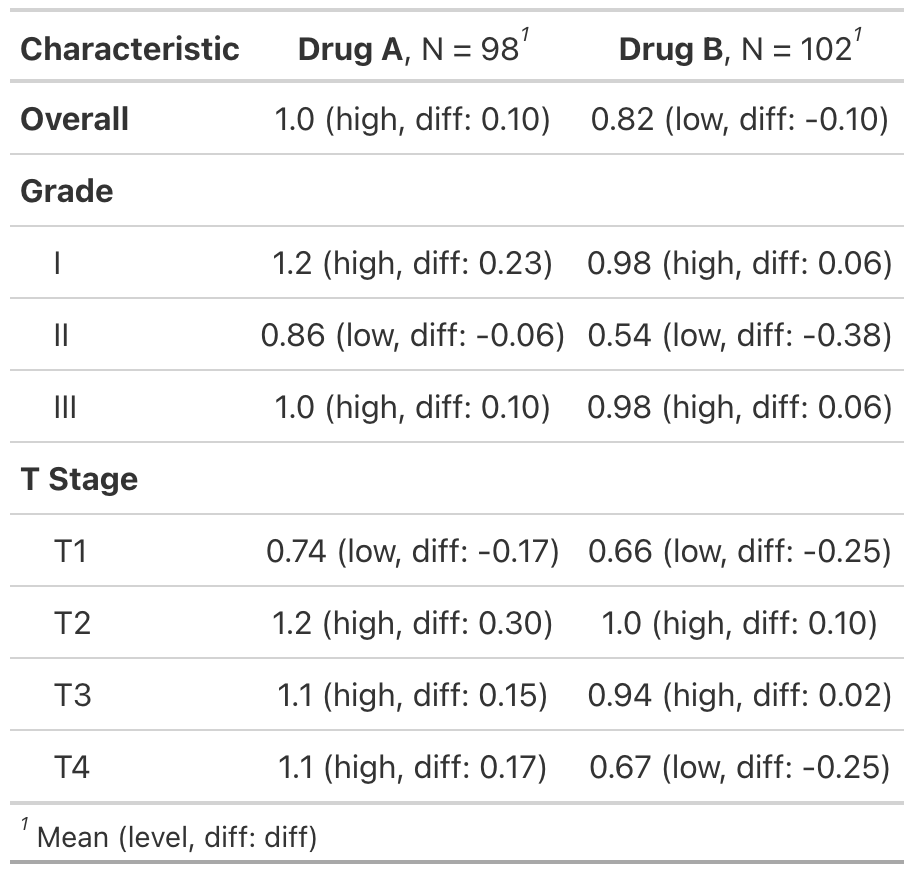
# Example 3 ----------------------------------
# Use `full_data` to access the full datasets
# Returned statistic can also be a character
diff_to_great_mean <- function(data, full_data, ...) {
mean <- mean(data$marker, na.rm = TRUE)
great_mean <- mean(full_data$marker, na.rm = TRUE)
diff <- mean - great_mean
dplyr::tibble(
mean = mean,
great_mean = great_mean,
diff = diff,
level = ifelse(diff > 0, "high", "low")
)
}
tbl_custom_summary_ex3 <-
trial %>%
tbl_custom_summary(
include = c("grade", "stage"),
by = "trt",
stat_fns = ~ diff_to_great_mean,
statistic = ~ "{mean} ({level}, diff: {diff})",
overall_row = TRUE
) %>%
bold_labels()
# }
Run the code above in your browser using DataLab