tbl_uvregression: Display univariate regression model results in table
Description
This function estimates univariate regression models and returns them in a publication-ready table. It can create univariate regression models holding either a covariate or outcome constant.
For models holding outcome constant, the function takes as arguments a data frame,
the type of regression model, and the outcome variable y=. Each column in the
data frame is regressed on the specified outcome. The tbl_uvregression
function arguments are similar to the tbl_regression arguments. Review the
tbl_uvregression vignette
for detailed examples.
You may alternatively hold a single covariate constant. For this, pass a data
frame, the type of regression model, and a single
covariate in the x= argument. Each column of the data frame will serve as
the outcome in a univariate regression model. Take care using the x argument
that each of the columns in the data frame are appropriate for the same type
of model, e.g. they are all continuous variables appropriate for lm, or
dichotomous variables appropriate for logistic regression with glm.
Usage
tbl_uvregression(
  data,
  method,
  y = NULL,
  x = NULL,
  method.args = NULL,
  exponentiate = FALSE,
  label = NULL,
  include = everything(),
  tidy_fun = NULL,
  hide_n = FALSE,
  show_single_row = NULL,
  conf.level = NULL,
  estimate_fun = NULL,
  pvalue_fun = NULL,
  formula = "{y} ~ {x}",
  add_estimate_to_reference_rows = NULL,
  conf.int = NULL,
  ...
)
Value
A tbl_uvregression object
Arguments
- data
Data frame to be used in univariate regression modeling. Data frame includes the outcome variable(s) and the independent variables. Survey design objects are also accepted.
- method
Regression method (e.g. lm, glm, survival::coxph,
survey::svyglm, and more).- y
Model outcome (e.g.
y = recurrenceory = Surv(time, recur)). All other column indatawill be regressed ony. Specify one and only one ofyorx- x
Model covariate (e.g.
x = trt). All other columns indatawill serve as the outcome in a regression model withxas a covariate. Output table is best whenxis a continuous or dichotomous variable displayed on a single row. Specify one and only one ofyorx- method.args
List of additional arguments passed on to the regression function defined by
method.- exponentiate
Logical indicating whether to exponentiate the coefficient estimates. Default is
FALSE.- label
List of formulas specifying variables labels, e.g.
list(age ~ "Age", stage ~ "Path T Stage")- include
Variables to include in output. Input may be a vector of quoted variable names, unquoted variable names, or tidyselect select helper functions. Default is
everything().- tidy_fun
Option to specify a particular tidier function for the model. Default is to use
broom::tidy(), but if an error occurs then tidying of the model is attempted withparameters::model_parameters(), if installed.- hide_n
Hide N column. Default is
FALSE- show_single_row
By default categorical variables are printed on multiple rows. If a variable is dichotomous (e.g. Yes/No) and you wish to print the regression coefficient on a single row, include the variable name(s) here--quoted and unquoted variable name accepted.
- conf.level
Must be strictly greater than 0 and less than 1. Defaults to 0.95, which corresponds to a 95 percent confidence interval.
- estimate_fun
Function to round and format coefficient estimates. Default is style_sigfig when the coefficients are not transformed, and style_ratio when the coefficients have been exponentiated.
- pvalue_fun
Function to round and format p-values. Default is style_pvalue. The function must have a numeric vector input (the numeric, exact p-value), and return a string that is the rounded/formatted p-value (e.g.
pvalue_fun = function(x) style_pvalue(x, digits = 2)or equivalently,purrr::partial(style_pvalue, digits = 2)).- formula
String of the model formula. Uses glue::glue syntax. Default is
"{y} ~ {x}", where{y}is the dependent variable, and{x}represents a single covariate. For a random intercept model, the formula may beformula = "{y} ~ {x} + (1 | gear)".- add_estimate_to_reference_rows
add a reference value. Default is FALSE
- conf.int
Logical indicating whether or not to include a confidence interval in the output. Defaults to
TRUE.- ...
lifecycle::badge("experimental")Additional arguments passed to
broom.helpers::tidy_plus_plus()
Example Output
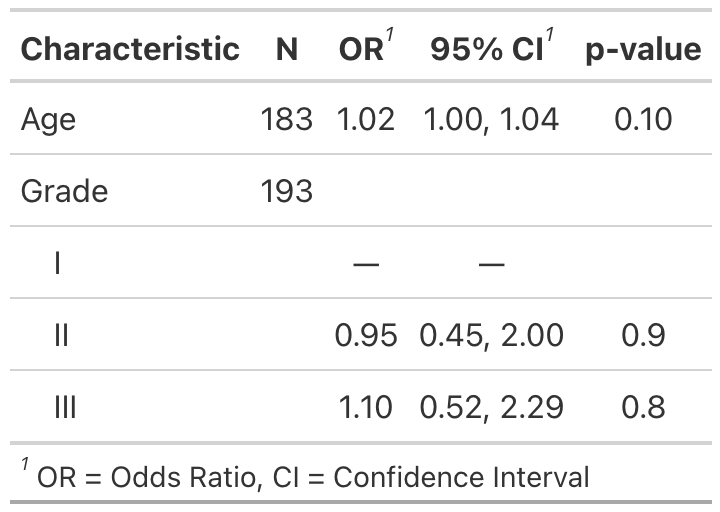
Example 1
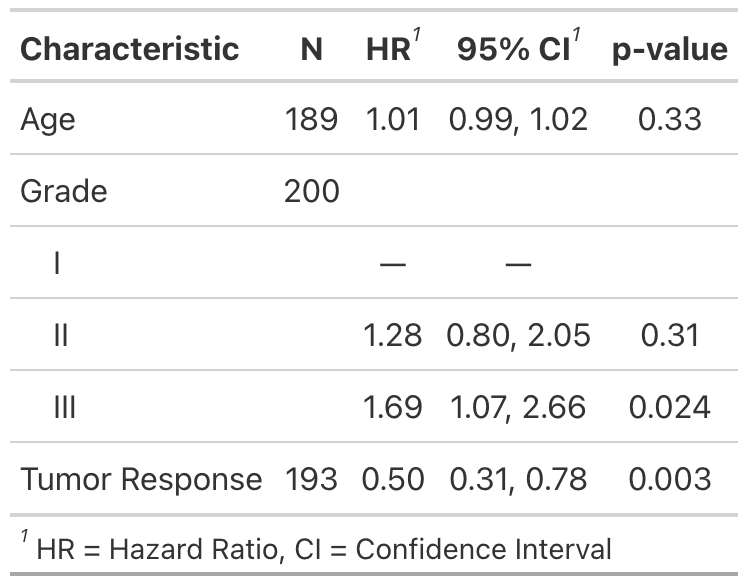
Example 2
Methods
The default method for tbl_regression() model summary uses broom::tidy(x)
to perform the initial tidying of the model object. There are, however,
a few models that use modifications.
"parsnip/workflows": If the model was prepared using parsnip/workflows, the original model fit is extracted and the originalx=argument is replaced with the model fit. This will typically go unnoticed; however,if you've provided a custom tidier intidy_fun=the tidier will be applied to the model fit object and not the parsnip/workflows object."survreg": The scale parameter is removed,broom::tidy(x) %>% dplyr::filter(term != "Log(scale)")"multinom": This multinomial outcome is complex, with one line per covariate per outcome (less the reference group)"gam": Uses the internal tidiertidy_gam()to print both parametric and smooth terms."tidycrr": Uses the tidiertidycmprsk::tidy()to print the model terms."lmerMod","glmerMod","glmmTMB","glmmadmb","stanreg","brmsfit": These mixed effects models usebroom.mixed::tidy(x, effects = "fixed"). Specifytidy_fun = broom.mixed::tidyto print the random components.
Author
Daniel D. Sjoberg
See Also
See tbl_regression vignette for detailed examples
Review list, formula, and selector syntax used throughout gtsummary
Other tbl_uvregression tools:
add_global_p(),
add_q(),
bold_italicize_labels_levels,
inline_text.tbl_uvregression(),
modify,
tbl_merge(),
tbl_split(),
tbl_stack(),
tbl_strata()
Examples
Run this code# \donttest{
# Example 1 ----------------------------------
tbl_uv_ex1 <-
tbl_uvregression(
trial[c("response", "age", "grade")],
method = glm,
y = response,
method.args = list(family = binomial),
exponentiate = TRUE
)
# Example 2 ----------------------------------
# rounding pvalues to 2 decimal places
library(survival)
tbl_uv_ex2 <-
tbl_uvregression(
trial[c("ttdeath", "death", "age", "grade", "response")],
method = coxph,
y = Surv(ttdeath, death),
exponentiate = TRUE,
pvalue_fun = function(x) style_pvalue(x, digits = 2)
)
# }
Run the code above in your browser using DataLab